|
1
|
- An analysis by
- Dr Alan Stewart MRCP
- www.stewartnutrition.co.uk
|
|
2
|
- “This provides a sound basis for the development of future food and
heath policies for this increasingly important group in our society“
- Tessa Jowell Minister for Public health DoH
- Jeff Rooker Minister of State MAFF
- The NDNS are undertaken by the Department of Health
- and Ministry of Agriculture Fisheries and Food with the
- support of outside agencies
|
|
3
|
- Dr Stewart took no part in the study and reports here as an independent
physician with an interest in nutrition
- The findings of this survey are not well-known and are not currently
available at the Department of Health website nor the Office of National
Statistics despite being listed on the latter site as available. The printed report can be purchased
from The Stationery Office www.tsoshop.co.uk
- The findings of this survey will be superseded by the NDNS Rolling
Programme, which includes those aged over 65 yrs and is due to finish
reporting years 1 and 2 of the three year programme toward the end of
2012
|
|
4
|
- Part of a rolling programme of national nutritional surveys of different
sectors of the British population
- Previous study of a non-representative sample of 365 elderly >70
years showed:
- malnutrition in 7%, anaemia in 12.5%
- vitamin B12 deficiency 2.5%, folate deficiency 5.4%
- vitamin B1 deficiency 8%, vitamin B12 deficiency 30%
(DHSS 1979)
- Risk of deficiency rose with increasing age, prevalence of chronic
illness and socio-economic deprivation
- Link between poor nutrition and common diseases; cardiovascular, poor
immunity, osteoporosis and possibly mental illness and early dementia
- A study of acutely ill geriatric patients in Leeds revealed a high
incidence of nutritional deficiencies (next two slides)
|
|
5
|
- 93 acutely ill patients >65yrs: male = 35, female = 58 in Yorkshire
- Folate and vitamin B12 were measured using micobiological assays
- 9/93 = plasma albumin ,<28g/l,
29/93 = plasma albumin 28-34g/l
- Morgan AG et al. Int J Vit and Nut Res.
1973:43;46-471 & 1975:45:448-462
|
|
6
|
- 93 acutely ill patients >65yrs: male = 35, female = 58
- PTT = prothrombin time (Vit K), TPP = thiamin pyrophosphate effect (vit
B1)
Vit B2 = whole blood riboflavin, Vit B3 = urine n-methyl
nicotinamide level
- Morgan AG et al. Int J Vit and Nut Res. 1975:45:448-462
|
|
7
|
- Two nationally representative samples:
- free-living
- institutionalised
- Individuals were identified by their postal addresses
- Men equalled women except those aged 85+ (more women)
- In each co-operating institution three residents were selected
- Initial assessment by interview
- Consent or proxy-consent obtained for participation and permission to
flag the NHS Central Register of Births and Deaths to give future notice
of death or cancer development
- Payment of £10 on completion of dietary record
- Survey completed between October 1994 to September 1995
- Acutely ill elderly are unlikely to have participated in NDNS 65+;
prevalence of poor nutrition is thus likely to be at least as great in
ill patients in the care of medical staff
|
|
8
|
- Interviewer-administered questionnaire about dietary habits, medication
use, nutritional supplements, physical activity and health
- Four-day weighed dietary record of all food and drink consumed in and
out of the home
- Seven-day record of bowel movements
- Memory and depression questionnaires
- Physical measurements: height, weight, mid-arm circumference, hand grip
strength and visual acuity
- Blood and urine (not 24 hours) tests
- Dental examination (see separate report)
|
|
9
|
- 30, 546 sample addresses
- 23, 486 positive responders
- 6,445 eligible households
- 2172 initially selected Eligible sample 100%
- 1632 completed interview Responding sample 75%
- 1275 completed dietary record Diary sample 59%
- 986 provided blood sample 45%
- 1115 provided urine sample 51%
|
|
10
|
- 454 initially identified Eligible sample 100%
- 428 completed interview Responding sample 94%
- 412 completed diet record Diary sample 91%
- 290 provided blood sample 64%
- 310 provided a urine sample 68%
- Some weighting for disproportionate sampling of sex, age,
- over-representation of people living alone and regional
- variations
|
|
11
|
- Nutritional deficiency can develop as a result of an inadequate intake,
poor absorption, illness, alcohol excess & other factors
- In the UK nutrient intake requirements are given in:
Dietary Reference Values for Food Energy and Nutrients for the
United Kingdom (1991 – TSO)
- The report defines The Lower Reference Nutrient Intake, LRNI, for
protein or a vitamin or mineral as “an amount of the nutrient that is
enough for only a few people in a group who have low needs”.
- In practice this means that if the percentage of a population with an
intake below the LRNI for a particular nutrient exceeds 3% then it is
likely that a percentage of the population will be deficient in the
nutrient
- Also deficiency is likely, but not certain, if, on testing its blood
level is below the lower end of an accepted normal range.
|
|
12
|
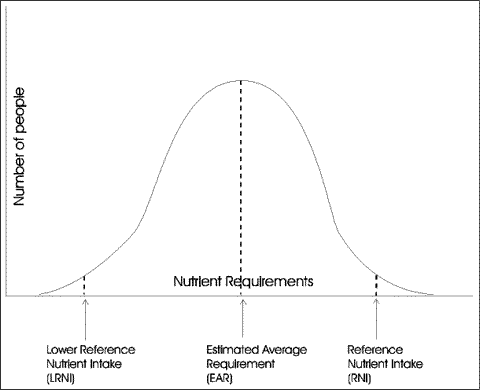
- Dietary Reference Values:
- Dept of Health 1991
- LRNI “An amount enough for only the few people in a group who have low
needs”
- EAR “About half will usually need more than the EAR and half less”
- RNI “An amount of the nutrient that is enough, or more than enough, for
about 97% of people in a group”
|
|
13
|
- Two main types of data:
- dietary habits and intake of nutrients
- test information on nutrient levels in blood and urine
- Assess the prevalence of both types of malnutrition:
- undernutrition
- overnutrition
- Data about social circumstances, alcohol and smoking that allows
identification of those at risk of malnutrition
- Data about the health of the survey group may examine the possible health consequences of
malnutrition
|
|
14
|
- Develop over days to years in a logical and recognizable sequence
- State of Adequacy
- State of Negative Balance
- Decline in Tissue Stores
- Loss of Function:
1. Symptoms
2. Physical Signs
3. Organ Failure
- Death
|
|
15
|
- Stage NDNS 65+ Component
- State of Adequacy
- State of Negative Balance
1. Poor intake Diet + Supplements
2. Reduced absorption
3. Increased losses
4. Increased
requirement
5. Altered
metabolism Alcohol, drugs,
liver and renal
- Decline in Tissue Stores Tests
– blood and urine
- Loss of Function:
1. Symptoms Depression
2. Physical Signs
BMI
3. Organ Failure
Renal and Liver Function Tests
- Death Collected 17 yrs
later
|
|
16
|
- “Lower Reference Nutrient Intake – an amount of the nutrient that is
enough for only the few people in a group who have low needs” = 3% of
the population
- Prevalence rates >3% suggest that a significant % of the population
could be deficient
|
|
17
|
- Supplement categories have slight differences between the surveys
- Females are usually larger consumers of supplements than males
|
|
18
|
- Potassium content of the body is related to its water content and muscle
bulk
- There are no differences in LRNI between the sexes despite physical
differences
- The high LRNI for women results in a high percentage appearing deficient
- Plasma or serum potassium levels were not measured as part of any of the
NDNS
|
|
19
|
- Percentages for age >65 years are the author’s estimates from
presented data
- Underweight + ill individuals are likely to have been under-represented
in NDNS
|
|
20
|
- Based on Malnutrition Universal Screening Tool - MUST
- Underweight
- BMI >18.5kg/m2
- Unintentional weight loss
Loss >10% within the last 3 – 6 months
- Underweight + Unintentional Weight Loss
BMI 18.5 - 20kg/m2 and Wt Loss >5% within the last
3 – 6 mo.
- Others Risk Factors
Eaten little or nothing or unlikely to for >5 days
Poor absorptive capacity, high nutrient losses or increased needs
|
|
21
|
- Fragile skin
- Poor wound healing
- Apathy
- Wasted muscles
- Poor appetite
- Altered taste sensation
- Impaired swallowing
- Altered bowel habit
- Loose fitting clothes
- Prolonged illness:
chronic infection,
chest disease,
cardiac failure,
cancer etc.
|
|
22
|
- Fragile skin
- Poor wound healing
- Apathy
- Wasted muscles
- Poor appetite
- Altered taste sensation
- Impaired swallowing
- Altered bowel habit
- Loose fitting clothes
- Prolonged illness:
chronic infection,
chest disease,
cardiac failure,
cancer etc.
- Life Stage:
- extremes of age
- infants, adolesence, pregnancy
- Social Circumstances:
- in receipt of benefits
- living alone – especially men
- Medical History:
- loss: bleed, vomiting, diarrhoea
- chronic illness/organ failure
- Family History/Genetic Factors
- Medical Drug Use
- Poor mobility/lack of sun
- Smoking
- Symptoms and Physical Signs
|
|
23
|
- Annual income in £000s; upper income bands are compared with lowest
<4k/year
- Increasing income is associated with higher intake of protein and many
nutrients
|
|
24
|
- Intake determined from 4 day diary
- Caution, no adjustment for age, health, diet or supplements was made
- Non-drinkers were more likely to be older and have abnormal liver test
|
|
25
|
- History Intake: diet + supplements
Risk Factors for deficiency/XS
Symptoms of deficiency/XS
- Physical Anthropometric Measures
Examination (Body Mass Index - kg/m2)
Signs of Deficiency
Signs of Underlying Disease
- Laboratory Blood and Urine Tests
Investigation Bone Mineral Density
X-Ray
|
|
26
|
- Both studies assessed new patients, with no clear diagnosis who were
referred to a medical outpatient clinic
- The percentages relate to the information that was required to reach the
final diagnosis
- References:
Hampton JR et al. BMJ. 1975;2:486-9
Peterson MC et al. West Med J. 1992;156(2):163-5
|
|
27
|
- World Health Organisation Normal Ranges were used; women >12.0g/dl, men >13.0g/dl. British laboratories often use a
normal range of >11.5g/dl for women
- Levels of 11.5-11.9g/dl in women can result in symptomatic iron
deficiency
- In the elderly anaemia results from:
poor nutrient intake + bleeding, chronic illness and unknown
factors in equal frequency
|
|
28
|
- Normal ranges: females >
15.0ug/l, males > 20.0ug/l
- Plasma ferritin can be elevated by acute or chronic inflammation,
infection or liver disease and may not be a reliable measure of iron
status in ill and elderly people
|
|
29
|
- Macrocytosis (MCV >101fl) was seen in: 2% of free-living elderly and
3% of elderly in institutions.
- Macrocytosis can be due to vit B12/folate deficiency or alcohol excess
- Only a minority of those with vitamin B12 deficiency also had
macrocytosis
|
|
30
|
- The normal ranges for red cell folate and method of analysis varied from
other NDNS
- Folate status is influenced by dietary intake, illness, alcohol excess
and altered metabolism
|
|
31
|
- Plasma 25-OHD levels show considerable seasonal variation with low
levels being commonplace in late winter and spring.
- Dietary sources provide approximately 10% of intake of the vitamin.
- Preferred level for those with osteoporosis is >75 nmol/l
|
|
32
|
- Vitamin C status is adversely affected by smoking, use of aspirin and
NSAIDS
- Approximately 12% of the elderly took supplements likely to contain
vitamin C
- Approximately 28% of British adults smoke and less after the age of 65
years
- Aspirin was taken by 20% of free-living elderly and 24% of
institutionalised
|
|
33
|
- WHO lower end of normality, plasma level < 0.7 mmol/
- Plasma retinol levels may be temporarily lowered as a result of
infection and the acute phase response
- Severe deficiency, plasma <0.35 mmol/l, is very rare
|
|
34
|
- “Many would agree that iron, vitamin C, vitamin D and B complex vitamins
should be given for three to four weeks to elderly patients recovering
from a severe illness of any type ...”
- Editorial British Medical Journal. Nutrition in the Elderly
1974:1;212-3.
|
|
35
|
- NDNS 65+ and other surveys calculated the correlation coefficients
between the intake of many nutrients and it’s level in the blood
- The degree of correlation between these two was often less than 50% and
is usually best for the more water-soluble and better absorbed nutrients
- The reason for low correlation are many and include: level of intake,
limited or poor absorption, smoking and alcohol, and differences in
metabolism/transport of the nutrient
- In practice this means that clinicians should not rely too heavily on
dietary assessment but consider many other risk factors for under and
overnutrition
|
|
36
|
|
|
37
|
|
|
38
|
|
|
39
|
|
|
40
|
- Tests – red cell folate, serum vitamin B12; vitamins B1 & 2 by
enzyme activation, which increase with increasing deficiency
- CCs for vitamins B1 & 2 are -ve but are presented as +ve
- All CCS are significant (p<0.01) except vitamin B12 in men
|
|
41
|
- This important survey, though conducted 20 years ago reveals that:
- poor intake of micronutrients is common
- low BMI, anaemia and micronutrient deficiencies are
common
- Risk factors for undernutrition include:
- low income – or being in receipt of benefits
- increasing age
- smoking
- alcohol excess but not moderate intake
- illness especially chronic illness
- multiple drug therapy
- Risk Factors for undernutriiton detailed by NICE are presented next
|
|
42
|
- NICE Listed
- Fragile skin
- Poor wound healing
- Apathy
- Wasted muscles
- Poor appetite
- Altered taste sensation
- Impaired swallowing
- Altered bowel habit
- Loose fitting clothes
- Prolonged intercurrent illness: chronic infection,
chest disease,
cardiac failure,
cancer etc.
|
|
43
|
- Obesity BMI >30 kg/m2
M - 17%, F – 23%
- Alcohol excess >21/14 units/week ~ 10%
- Dietary Salt Intake >6g/day estimated at ~80%
risk of:hypertension, stroke, osteoporosis and heart failure
- Retinol - elevated plasma level ~10%
risk of:osteoporosis, hypercalcaemia (cc%)
- Iron excess - haemochromatosis ~1.5%
iron saturation >55%
- Trace element excess - reduced excretion due to:
renal disease (?<5%) – vitamin A and potassium
liver disease (10-20%) – iron, manganese and copper
- Excessive intake of nutrients from supplements
retinol (5-10%) and possibly manganese (not assessed)
|
|
44
|
- Total Safe Intake, TSI 1500 ug/day
- Diet provides average 700 ug/day
- Supplements limited to 800 ug/day
- % NDNS 65+ intakes >TSI
- F-L Males 11%,
Females 10%
- Inst. Males 7%,
Females 6%
- High intakes from:
- food – liver, very high dairy
- supplements high intake & overages
- Acute Toxicity: – rare >50,000ug/day
- liver failure, death
- Chronic Toxicity:
- osteoporosis (vit D antagonist)
- hair loss, dry skin
- hypercalcaemia (PTH excess)
- Risk increased by: renal impairment, alcohol excess and obesity
|
|
45
|
|
|
46
|
|
|
47
|
- Cod Liver Oil 10 mls
1,800ug
- Holford Multivitamin
1,200ug
- HealthSpan Multi 50+ 1,000
ug
- H and B ABC Plus Senior 1,050 ug
- Solgar Solovit 750 ug
- Biocare Adult Multi 600
ug
- According to industry overages are commonly 20% to 30% more than the
label claim
|
|
48
|
- The following slides detail the spread and extremes of nutrient intake
and laboratory findings from the free-living NDNS 65+ population
- These show the means, 95% limits and highest and lowest values for a
number of measures of nutrients
- These findings make the point that both under and over nutrition occur
- They help the practitioner put into perspective the results that they
might obtain when assessing their own patients
- Such data is unique and is unlikely to be reported in future survey
|
|
49
|
|
|
50
|
|
|
51
|
|
|
52
|
|
|
53
|
|
|
54
|
|
|
55
|
- Low intakes of folate increase the risk of alcohol-associated breast
cancer
- Moderate intakes have no effect on risk
- High intakes of folic acid from supplements may increase the growth of
an existing tumor
- The effect of folate/folic acid may be influenced by other nutrients and
genetic factors
|
|
56
|
- Deficiencies of both are common in NDNS 65+
- Supplement use is associated with better folate status but only slightly
better vit B12 status
Dangour A et al J. Nutr. 2008 138;1121-1128
- US NHANES III: those with a serum B12 <148 pmol/l (~35% of UK
elderly) increasing serum folate was associated with increased HCys and
MMA levels
Selhub J et al Am J Clin Nutr 2009;89(2):702S-706S
- European EPIC no overall association of prostate cancer risk and the
status of these nutrients
However in those with a high vitamin B12 level there was an
increased risk of more advanced disease.
Johansson M et al Cancer Epidemiol Biomarkers Prev
2008;17(2):279-85
See also Hultdin J et al Int J Cancer 2004;113:819-24
|
|
57
|
|
|
58
|
|
|
59
|
|
|
60
|
- Dietary intake and cognitive function were assessed in 3,718
community-dwelling participants age 65 years and older living in Chicago
over 6 years
- Those with a high dietary intake of saturated or trans fats and a high copper
intake had a greater rate of cognitive decline
- Comparing the highest quintile 2.75 mg/day vs lowest quintile 0.88
mg/day the difference in decline was -6.14 units/yr or the equivalent of
more than 19 yrs of age
- There was a strong dose-response association with higher dose copper in
supplements.
- There was no association in those whose diets were not high in these
fats.
|
|
61
|
- 38,772 women mean 61.6 yr in 1986; 40.2% died by end 2008
- Supplement use in 1986, 1997 and 2004 was associated with an increased
mortality, which may have been due to pre-existing illness
- Particular concerns about use of copper-containing products
|
|
62
|
|
|
63
|
- Serum Selenium was measured in 13,887 US adults
- Follow-up mortality data over 12 years
- Serum Selenium levels <130 ng/ml (1.6 umol/l)
Associated with an inverse association between serum selenium and
all-cause and cancer mortalities
- Serum Selenium levels >150 ng/ml (1.9 umol/l)
Associated with a modest increase in all-cause mortality
- No association between serum Se and cardiovascular mortality
- Normal Range:
Serum or Plasma Selenium 80 -150 ng/ml
1.0 -1.85 umol/l
|
|
64
|
- Abnormal LFTs in 10% - 30% of all UK adults
- Elevated Alk. Phosphatase -
cholestatic liver disease
- reduced excretion of:
Copper and Manganese
and increased mortality
- Elevated Gamma GT
- often alcohol excess
- obesity – NAFLD,
hepatitis
and drug-induced
- Chronic Liver Disease:
- elevated plasma retinol
- deficiencies of :
vitamins D, B,
- later vitamins A and K
- zinc
- iron accumulation
|
|
65
|
- Primary Biliary Cirrhosis is a not uncommon cause of chronic liver
disease especially in women
- Presents with fatigue and skin itching without jaundice
- Tests reveal raised alkaline phosphatase
- Studied 18 PBC patients 14 with early pre-cirrhotic
- Blood manganese elevated - reduced ability to excrete excess
- Accumulation of mineral in the brain (reduced magnetisation transfer
ratio in the globus pallidus) similar to industrial manganese excess,
which causes Parkinsonism
- Similar changes may occur in infants with biliary atresia
- Manganese accumulation can easily occur in those with cholestasis or
raised alkaline phosphatase level
- Reference: Fotron DM et al. Gut 2004;53:587-592.
Fatigue and primary biliary cirrhosis: association of globus
pallidus magnestisation transfer ratio measurements with fatigue
severity and blood manganese levels.
|
|
66
|
- Adult intakes average 2.77 – 3.42 [95% CI 1.05-8.11] mg/day
- Food sources: grains (50%), tea, beans, supplements 3%
- Deficiency rare but may occur in those fed parenterally
- 1.03% to 4.86% of dietary manganese is absorbed
- Absorption is increased in iron deficiency or by low intake
- Excess is excreted via the bile, if liver function is normal
- Safe Upper Level 4 mg but 0.5 mg/day for those aged >50 yrs
- Many UK preparations contain 1mg to 10 mg/day often with Glucosamine but
up to 60 mg/day in US imports
|
|
67
|
- UK Safe Upper Levels (SULs) Guidance Levels (GLs) “are the doses of
vitamins and minerals that susceptible individuals could take daily on a
life-long basis, without medical supervision.”
Single figure, applies to adults only, based on 60 kg
female
Total Safe Intakes (TSIs) are set for retinol and some trace
elements
- US Tolerable Upper Intake Levels (ULs)
Range of figures depending upon age and sex
“is the highest average daily nutrient intake level likely to
pose no risk of adverse effects for nearly all people in a particular
group”
Based on total intake from food, water and supplements
- EU Tolerable Upper Intake Level (UL)
“the maximum level of total chronic daily intake of a nutrient
(from all sources) judged to be unlikely to pose a risk of adverse
effects”.
ULs vary with age and sex and exclude “those under medical
supervision and certain disease states” but includes “sensitive
individuals”
|
|
68
|
- Stage NDNS 65+ Component
- State of Adequacy
- State of Negative Balance
1. Poor intake Diet + Supplements
2. Reduced absorption
3. Increased losses
4. Increased
requirement
5. Altered
metabolism Alcohol, drugs,
liver and renal
- Decline in Tissue Stores
Tests – blood and urine
- Loss of Function:
1. Symptoms
Depression
2. Physical Signs
BMI
3. Organ Failure
Renal and Liver Function Tests
- Death Data Collected
after 14yrs
|
|
69
|
- During 14 yrs of follow-up the causes of death were recorded for
free-living people; 74% of men and 62% of women died
- Mortality was predicted by baseline measures of:
- poor grip strength (men)
- low intakes of food and protein
- poor renal function - raised plasma creatinine and
homocysteine
- raised Hb A1c -
prediabetes/diabetes
- Mortality also predicted by plasma levels of nutrients:
- raised copper - infection, cancer, liver or inflammatory
disease
- raised plasma retinol – high intake, renal impairment, alcohol
XS
- low vitamin C
- low alpha-carotene
- low vitamin B6
- low vitamin D (men)
- low zinc and selenium
- Mortality was not predicted by:
- dietary intakes of folate and vitamin B12
- haemoglobin, serum/plasma vitamin B12, folate and
beta-carotene
- serum cholesterol
|
|
70
|
- Bates CJ et al Br. J Nutr. 104:893-9 & 105: and Osteop Int 2011
|
|
71
|
- Bates CJ et al Br. J Nutr. 104:893-9 & 105: and Osteop Int 2011
|
|
72
|
- Bates CJ et al Br. J Nutr. 104:893-9 & 105: and Osteop Int 2011
|
|
73
|
- Bates CJ et al Br. J Nutr. 104:893-9 & 105: and Osteop Int 2011
|
|
74
|
- Bates CJ et al Br. J Nutr. 104:893-9 & 105: and Osteop Int 2011
|
|
75
|
- n =1100, 50.2% Female. Baseline
1994/5; follow-up Sept 2008
- Mortality data and cause were collected – related to baseline data
- Mortality predictable by; plasma tHcys, pyridoxal PO4, creatinine, Glyc
Hb, alpha1-antichymotrypsin, fibrinogen, diet, but not folate/vit B12
intake/status
|
|
76
|
|
|
77
|
|
|
78
|
|
|
79
|
- Problems of nutritional deficiency and excess are common in ageing
populations and frequently co-exist in patients
- The commonest cause of undernutrition is poor dietary intake but alcohol
excess, illness and medical drugs are also factors
- Both types of problem are under-recognised
- Both under and overnutrition can be detected by careful history (diet,
risk factors and symptoms), examination and investigation
- Many such problems are preventable & treatable but the value of
treating and the best method of doing so are not clear
- Nutrition decline and excess can also be part of the ageing process and
may develop in terminal situations
- Doctors, patients and society in general need to decide just how far
they can go in assessing and managing these problems
|
|
80
|
- Current NDNS Rolling Programme includes >65 yrs
data for years 1 and 2 (of 3) have reported on:
- methodology and nutrient intake
- blood data will be reported on in late 2012
- UK Population changes include:
- small increase in fruit and vegetable consumption
- continuing decline in saturate and trans-fats
- increase in alcohol and excessive alcohol consumption -
continuing low levels of activity by many
- increase in obesity
- increased supplement use especially calcium and vit. D
- increased use of medication
- Increased longevity and increased disease
- longevity improved mainly in non-deprived but more;
T2D, liver/renal disease, cancer, dementia and osteoporosis
|
|
81
|
- Achieve food-based targets for: protein, fish/oily fish, dairy,
nutritious carbohydrates and fruit & vegetables
- Do not exceed limits for salt, sugar, alcohol and fats
- Avoid obesity and underweight
- Be active and get out of doors
- Socialise, eat and be active with others and maintain interests
- Have medical treatment when ill
- Make use of supplements when necessary and avoid excess
- Encourage others to do likewise
|
|
82
|
- Thank you for your attention
- More information is available in lecture form on:
- Nutritional Assessment
- Low Income Diet and Nutrition Survey
- Safety of Nutritional Supplements
- I would welcome your feedback on this and other presentations dr.stewart@stewartnutrition.co.uk
- Dr Stewart is available to lecture on these topics
|

 Notes
Notes